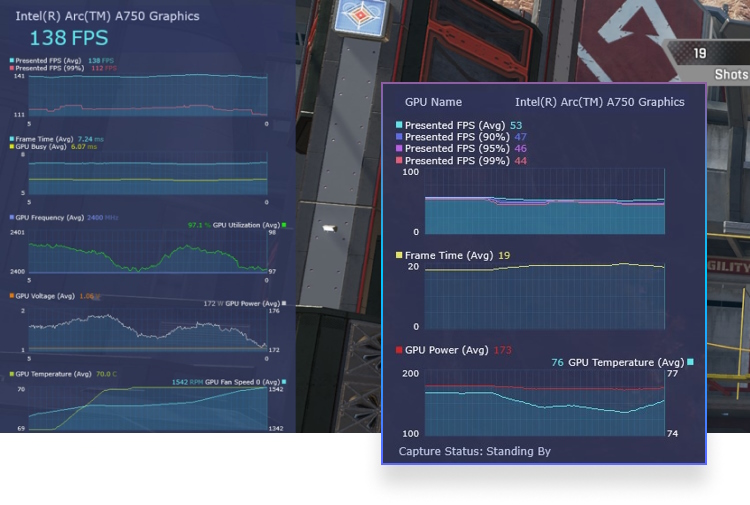
Intel's frame capture tool, PresentMon, has recently been updated to version 2.0. The new update brought some much-needed bug fixes, but more importantly, it introduced new features that enthusiasts were asking for.
This updated version includes several new features, improvements, and fixes. One of the most exciting capabilities is the addition of its own overlay and graphing features, allowing developers to integrate their tools into the overlay without needing separate applications.

Furthermore, this new version has relocated most metrics' reference points and percentile statistics now offer explicit values of 1%, 5%, and 10%. You can check the detailed patch notes below:
New Features
- The majority of metrics are changed to use the time that the CPU started working on a frame as the reference point instead of the present() call, with values that are more aligned to measuring the quality of graphics applications (e.g., latency and duration of interaction and displayed frames). See README-ConsoleApplication.md for more details.
- Processes with unknown name are now reported as <unknown> instead of <error>.
- Capture application CSV now reports NA (Not Available) in columns for unavailable metrics instead of 0.
- Overlay / Capture application now hides any metrics that are not available on the system.
- Added explicit 1%, 5%, and 10% percentile statistics (to the existing 99%, 95%, and 90%). Previously, selecting 99%ile for metrics where a lower value is better (such as frame time) would automatically convert to the 1%ile statistic. Now, no context-dependent conversion is done and whatever statistic the user selects is displayed.
- Added a non-zero average statistic which only averages non-zero data points. This is useful for metrics where zero denotes “no data” rather than a zero value (such as the click-to-photon latency metric).
- Added histogram plots.
- Client APIs:
- New Dynamic query composition API: clients now specify which metrics/stats they are using, and only the necessary data processing is performed. This replaces the previous behavior where all metric combinations were calculated on each polling call, regardless of whether they were necessary.
- New Introspection API: clients can now enumerate metrics at runtime to populate UIs with options, names, and descriptions. Also enables clients to be forward-compatible with newer service builds exposing new metrics.
- PresentData: changed PresentStopTime to TimeInPresent where PresentStopTime = TimInPresent == 0 ? 0 : PresentStartTime + TimeInPresent
Bug Fixes
- Fixed crash caused by resetting preferences
- Fixed graph rendering errors when sampling rate was high and/or graph contained many data plots
- Disallow editing for built-in loadout presets
- Fixed issue where autoscaling settings was affecting the wrong graph
- Fixed issue where independent data display window would repeatedly appear above the control UI making it difficult to interact with the application
- Fixed overlay UI misalignment in readout widgets caused by very small values
- Loadout files are now saved with .json file extension by default
You can now download the latest PresentMon version on its GitHub page.
KitGuru says: Have you already tried Intel PresentMon? What do you think of it?
The post Intel updates PresentMon monitoring software to version 2.0 first appeared on KitGuru.
0 comments :
Post a Comment